Navigraph Charts 8 is now available with VFR charts, drag-and-drop routing, infinite zoom, and more!


Just as promised last week, Navigraph has finally released today the much-awaited new version of its Charts app. Charts 8 is now available to Navigraph subscribers with all the existing features they love and the addition of worldwide VFR charts, drag and drop route construction, seamless zoom from space to airport gate, and more!
Navigraph Charts 8 has been teased and previewed for a while, as Navigraph introduced users to exciting new features that have been in development for months. VFR charts will finally make an appearance in Navigraph, with a visually rich interactive map with visual reporting points, entry and exit routes, traffic patterns, and more, all while having a number of data layers that can display coastlines, terrain, railroads, windmills, and many other POIs.
Route creation in Navigraph Charts 8 also becomes a lot more intuitive, with drag-and-drop capabilities that enable easy route plotting and snapping to known waypoints.


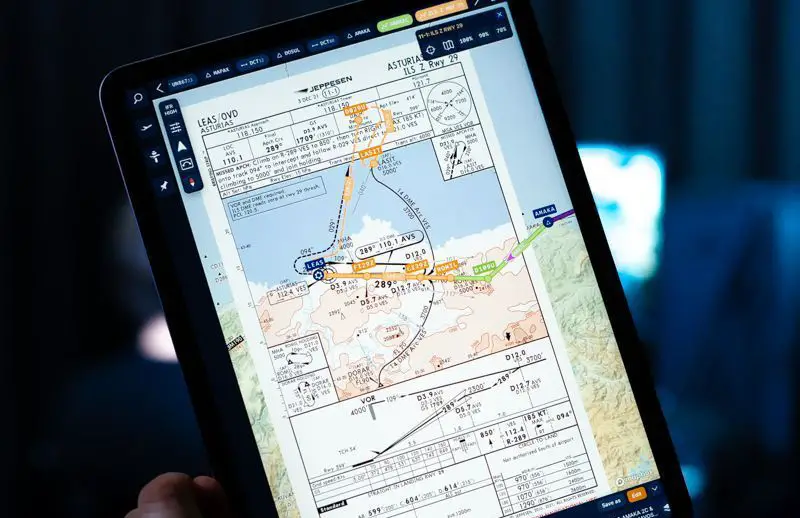
The introduction of vector charts also makes for seamless and high-quality zooming across the whole range of the Jeppesen charts. See them from afar for a general overview of the airport, or zoom right into the gates to get a clear view of the layout to plan your taxiing.
See below a quick summary of the major new features introduced in this new version of Navigraph Charts, along with some details about planned features for subsequent updates!
Charts 8 is a brilliant update to the Navigraph service, a long-time must-have for many IFR fliers that is now also trying to grab the attention of VFR pilots. A Navigraph Ultimate subscription is required (it costs €8.30 per month or €74.90 per year).
New Features in Navigraph Charts 8:
 Worldwide VFR Charts
Navigraph Charts displays a worldwide interactive map with visual reporting points, entry and exit routes, traffic patterns, transition routes, and flyways. As selectable data layers, Navigraph Charts also display coastlines, terrain, water bodies, roads, railroads, powerlines, windmills, churches, landmarks, obstacles, highpoints, and waterways. Airspaces are clearly marked, and so are populated areas, avoid-overflying zones, and minimum off route altitudes (MORA).
Drag and Drop Route Construction
Creating a route is now as intuitive as pulling a rubber band across waypoints. The route will snap to known waypoints. Arbitrary waypoints can be added by long pressing the route. The textual route string updates accordingly to reflect the interactive changes. Each route segment displays distance and heading.
The drag and drop function will not be available for Android and iOS devices in the initial release.
Seamless Zoom
It is now possible to zoom all the way from space down to airport level and see terminal buildings, gates, stop lines, and even windsock locations. A pixel at the greatest zoom is 1.5 meters at the equator. This feature will be particularly useful for pilots while taxiing.
3D Globe Projection
Ever since the Apollo 8 mission, humans have been mesmerized by the view of our home as seen from space. Now you can do the same – Navigraph Charts on a globe projection is not only beautiful to look at, but it also helps visualize Great Circle distances and polar routes.
Autopinning of Procedure Charts
When planning a flight, Navigraph Charts 8 can automatically place the relevant airport diagrams and procedure charts in a pinboard which can be stored with the flight, or saved separately. This feature saves the time and effort required to organize the charts needed for a flight for easy access as the pinboard always floats at the bottom of the interface.
Airport Crosswind and Weather Information
When selecting a runway for takeoff or landing unfavorable winds are indicated with red arrows. Similar to a traffic light, runways with favorable winds are marked with green arrows. The airport wind information is updated in real time together with current weather (METAR) and predicted conditions (TAF). Weather reports are color encoded to denote flight categories permitted in Visual Meteorological Conditions: VFR, MVFR, or IFR.
Planned features for the coming months:
- Weather layers – winds, precipitation, cloud coverage, and more
- Navlogs – to keep track of past flights, hours, and statistics
- Profile views – phases of flight, level changes, terrain
- Traffic visualization – other popular networks
- Charts annotations – to take taxi instructions on the charts


 now available for MSFS from Axonos 17")